When you create different links in WappChat like custom links, catalog links, or form links, you also need one place to monitor everything. The WappChat Dashboard and Analytics sections inside WappChat are designed exactly for that.
You can view every detail from total clicks to performance trends, all from one clear and organized page. This feature helps you manage your links smartly and make better business decisions without wasting time on guesswork.
Understanding the WappChat Dashboard #
The Dashboard Overview is like your control room. It gives you a quick summary of all your link data, agent usage, and recent activities. You can think of it as a bird's-eye view of your entire WhatsApp link system.
Main Sections of the Dashboard #
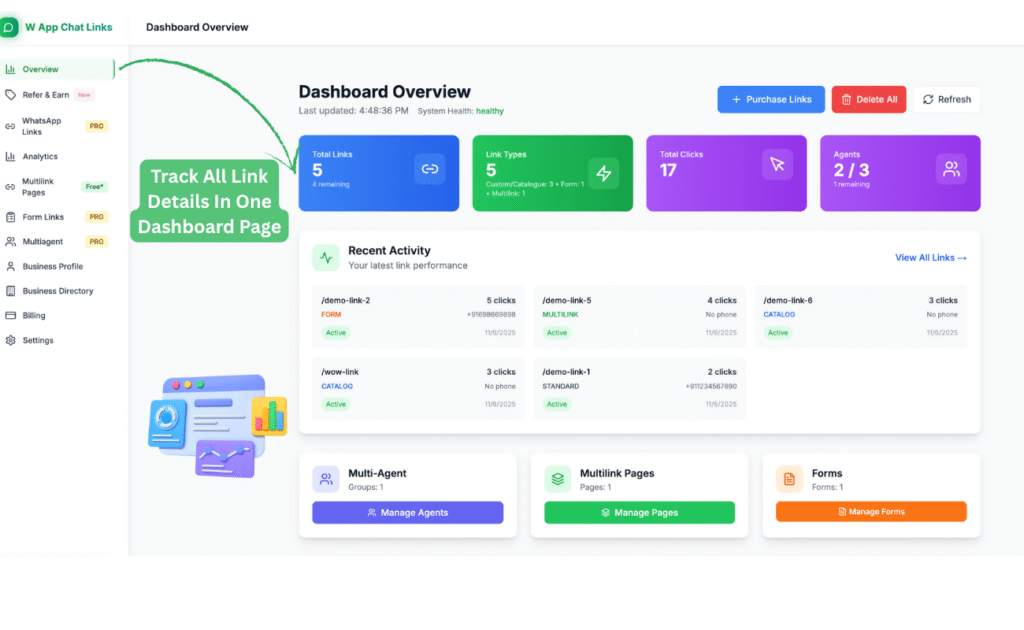
When you open your WappChat account, click on Overview in the sidebar. You'll see your Dashboard Overview screen with these main parts.
1. Total Links: This shows how many links you have created and how many you can still create based on your plan. It helps you keep track of your remaining limit before upgrading or purchasing new link credits.
2. Link Types: This section displays how many types of links you have created. For example, it will show counts for custom, catalog, form, and multilink pages. You can instantly see which type you use most.
3. Total Clicks: This number shows how many times your links were clicked in total. It is useful for understanding engagement levels across all your links.
4. Agents: If you use multi-agent routing, this box shows how many agents are active and how many slots you have left. You can use it to check your agent usage status quickly.
5. Recent Activity: This list shows the most recent links that received clicks. It displays the link type, number of clicks, phone number, and status. You can use it to know which links are performing the best today.
6. Quick Access Buttons: At the bottom, you'll find quick access to Manage Agents, Manage Pages, and Manage Forms. You can jump straight into editing without navigating through menus.
How to Use the Dashboard Effectively #
You can visit the Dashboard daily to check link performance at a glance. Use it to:
- Monitor which links are getting attention.
- Track if your agent team is using their limits efficiently.
- Detect inactive links or low-performing ones.
- Keep an eye on system health and overall link usage.
The Dashboard updates automatically, so you don't need to refresh manually. Still, you can click the Refresh button at the top whenever you want the latest data.
Benefits of Using the Dashboard #
- You can track everything in one place.
- You can check performance of links, forms, and agents in seconds.
- You can avoid over-using your link limit.
- You can spot which campaigns are getting better engagement.
So, the main idea is that the Dashboard saves time and keeps you informed without needing any third-party tools.
Exploring WappChat Analytics #
While the Dashboard gives you a quick summary, the Analytics section goes deeper. This is where you understand how your audience interacts with your links, how your brand is performing, and where your visitors are coming from.
Accessing the Analytics Section #
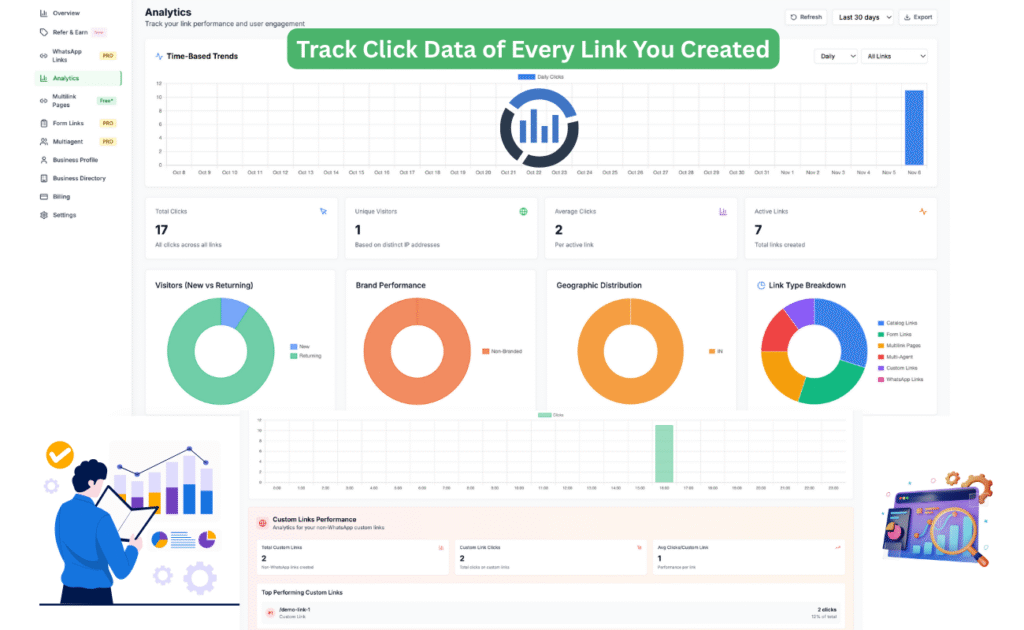
To open it, click on Analytics from the sidebar menu. You'll see detailed charts and graphs for every click and visit your links get.
Key Insights You'll Find #
1. Time-Based Trends: At the top, you can view a line graph showing the number of clicks per day. This helps you spot busy days and understand when your audience interacts most.
2. Total Clicks and Unique Visitors: These metrics show how many total clicks your links have received and how many unique users visited. This is useful to measure reach and engagement.
3. Average Clicks per Link: This number tells you the average performance per link. It helps you find which links need more attention or redesign.
4. Visitor Behavior: A circular chart shows how many visitors are new and how many are returning. This helps you know if your content is bringing repeat users or only one-time visitors.
5. Brand Performance: This part shows the ratio of branded versus non-branded links. It is helpful if you want to measure how much traffic comes from your custom short links instead of default ones.
6. Geographic Distribution: This section breaks down where your clicks are coming from by region or country. It helps you understand your audience location for better targeting.
7. Link Type Breakdown: You can view which type of links get the most attention. It separates Catalog Links, Form Links, Multilink Pages, Custom Links, and WhatsApp Links. This insight is great for comparing link effectiveness.
8. Custom Links Performance: At the bottom, you'll see details about your custom links specifically. It lists each link, total clicks, and performance averages. You can easily identify your top-performing custom link here.
How to Read and Use Analytics for Growth #
Once you understand these charts, you can use them to improve your WhatsApp marketing and communication strategies. Here's how:
Track Your Best Performing Links: Look for links that get the most clicks. Study what message or placement made them perform better and repeat that pattern for future campaigns.
Find the Right Time to Share Links: Use the time-based trend graph to learn when users click the most. Post or send your links during those hours to get more engagement.
Understand Your Audience Location: The geographic data tells you which country or region responds most to your links. You can then focus your promotions or content toward those areas.
Measure Branding Impact: If your branded links outperform non-branded ones, you know your custom URLs are building trust. Keep using clear, easy-to-remember link names.
Identify Returning Visitors: If a large part of your visitors are returning users, it means your service has strong engagement. You can start targeting them with more personalized messages or offers.
Practical Use Cases #
Here are a few real situations where the Dashboard and Analytics features work together perfectly.
- A restaurant uses the Dashboard to check how many people click their menu link each day and the Analytics to see which time slot gets the most visits.
- A freelancer tracks how many clients open their WhatsApp form links to measure interest.
- A small business uses geographic data to plan promotions in cities where more users click.
- A marketing team monitors total clicks daily to know which campaign link performs best across all agents.
In short, the Dashboard gives the overview, and Analytics gives the deep story behind your link performance.
Steps to Check and Use Analytics in WappChat #
- Log in to your WappChat account.
- Click Analytics from the sidebar.
- Select the time range, like last 7 days or last 30 days.
- Review the daily click graph to see activity patterns.
- Check total clicks, unique visitors, and link type performance.
- Scroll down to find custom link performance details.
- Export data if needed for reports or team sharing.
You can repeat this weekly to track progress and set better goals.
Why These Features Matter for Businesses #
Businesses using WappChat can stay ahead by monitoring what works and what doesn't. Instead of guessing, you can rely on real-time data.
You know which links customers open, how they reach you, and what time they prefer chatting or browsing.
That helps improve marketing, support response, and communication flow. Above all, it builds a data-driven habit for your team without needing complex tools.
Checklist #
- Check the Dashboard Overview daily
- Track total clicks and agent usage
- Review Analytics weekly for trends
- Study visitor locations and returning user ratios
- Focus more on top-performing link types
- Use data to plan campaigns or refine messages
Final Thought #
WappChat Dashboard and Analytics together act as your all-in-one performance tracker. You can view every click, track every link, and learn what drives customer action. When used regularly, they help you make better decisions, save time, and grow your business smarter through WhatsApp.
Written by
Sourabha Kumar Sahu
Founder of WApp Chat, building tools that help businesses grow with WhatsApp.